GLOSSARY REPORT 1
STANDING
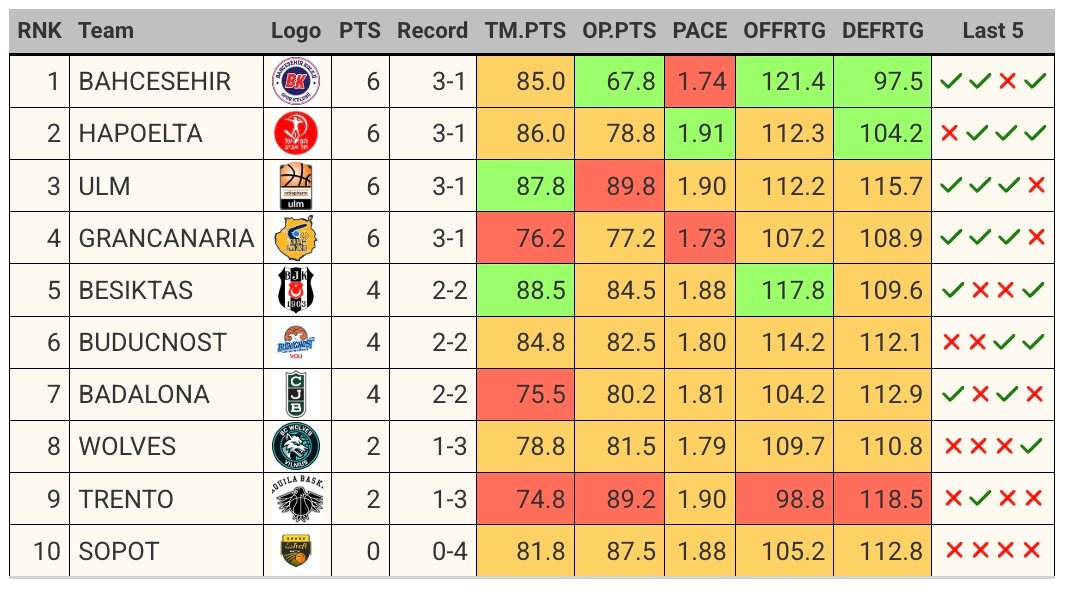
RNK: Ranking position.;
PTS: Points in the standings;
Record: Wins-losses;
TM.PTS: Average points scored;
OP.PTS: Average points conceded;
PACE: Number of possessions per minute;
OFFRTG: Points scored per 100 possessions;
DEFRTG: Points conceded per 100 possessions;
Last 5: Last 5 results.
TOP 5 TEAMS (Selected Round)
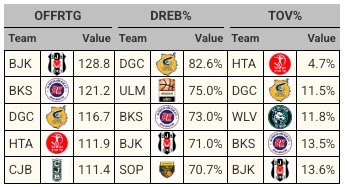
Refers ONLY to the round selected by the user, top 5 teams for:
OFFRTG: points per 100 possessions;
DREB%: defensive rebound percentage, computed as DREB/(DREB+OREB opponents);
TOV%: percentage of possessions that ended in a turnover.
TOP 5 PLAYERS (Selected Round)
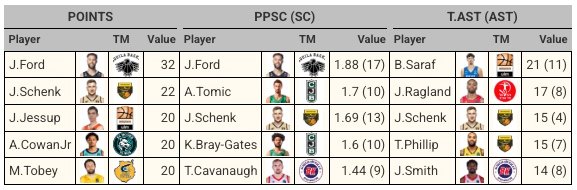
Refers ONLY to the round selected by the user, top 5 player for:
PTS: points scored;
PPSC: efficiency, computed as PTS/SC, where SC is the number of shot attempts used by the player;
T.AST(AST): total number of assists. T.AST = AST + PAST, where PAST are potential assists and AST are actual assists.
GAME INFO CARD
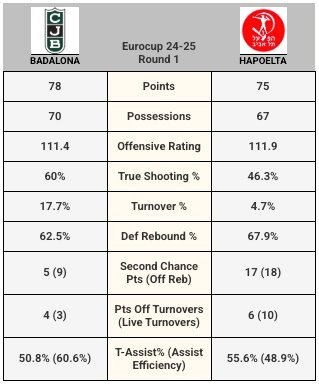
For each game in the round selected by the user, a card is generated with the following data:
Points: points scored;
Possessions: number of offensive possessions played in the game;
Offensive Rating: points scored per 100 possessions;
True Shooting %: shooting percentage that includes all types of shots (2pt, 3pt, free throws);
Turnover %: percentage of possessions ending in a turnover;
Def Rebound %: defensive rebound percentage, calculated as DREB/(DREB + opponents’ OREB);
Second Chance Pts (Off Reb): points scored after an offensive rebound,
with the number of offensive rebounds in parentheses
Pts Off Turnovers (Live Turnovers): points scored after a live turnover
by the opponents, with the number of live turnovers by the opponents in parentheses.
A live turnover is when the ball remains in play after the turnover
TEAM ADVACED BOX SCORE
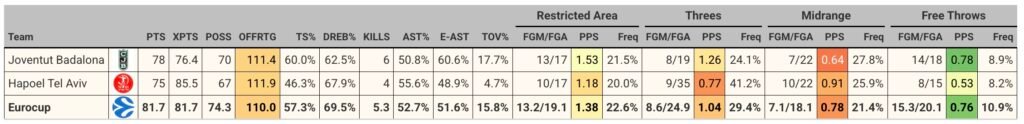
Advanced Box Score: advanced statistics for the teams
in the selected game + comparison with league averages
PTS: points scored;
XPTS: expected points;
POSS: number of offensive possessions played in the game;
OFFRTG: Offensive Rating, points scored per 100 possessions;
OFFRTG: Offensive Rating, points scored per 100 possessions;
TS%: True Shooting %, shooting percentage that includes all types of shots (2pt, 3pt, free throws);
DREB%: defensive rebound percentage, calculated as DREB/(DREB + opponents’ OREB);
KILLS: number of kills in the game. A kill is achieved by stopping the opponent’s attack for 3 consecutive possessions
AST%: how many shots out of the total number of shots were assisted;
E-AST: how many shots out of the total number of assisted shots were
scored;
TOV%: percentage of possessions ending in a turnover;
Shooting performance: for Restricted Area (shots at the rim), Threes, Midrange (2-pt not at the rim), and Free Throws:
FGM/FGA: Field goals made / Field goals attempted;
PPS: Points per shot (FGM/FGA × shot value);
Freq: % of shot opportunities used for that type of shot
Shooting analysis: contested & assisted factors
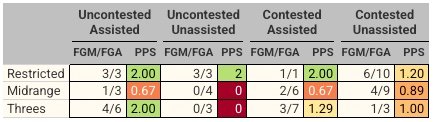
An analysis of shooting efficiency in three key areas of the court, evaluated through the dual impact of defensive pressure (contested/uncontested shots) and offensive creation (assisted/unassisted shots).
FGM/FGA: field goals made/field goals attempted;
PPS: points per shot (FGM/FGA × shot value);
Court zones: Restricted (shots at the rim), Perimeter (shots outside the restricted area), and Transition (shots taken after a turnover or fast break).
FGM/FGA: field goals made/field goals attempted;
PPS: points-per-shot (FGM/FGA × shot value);
Field areas: Restricted (shots at the rim), Midrange (2-point, no rim), Threes (3-point)
Player Advanced Box-Score
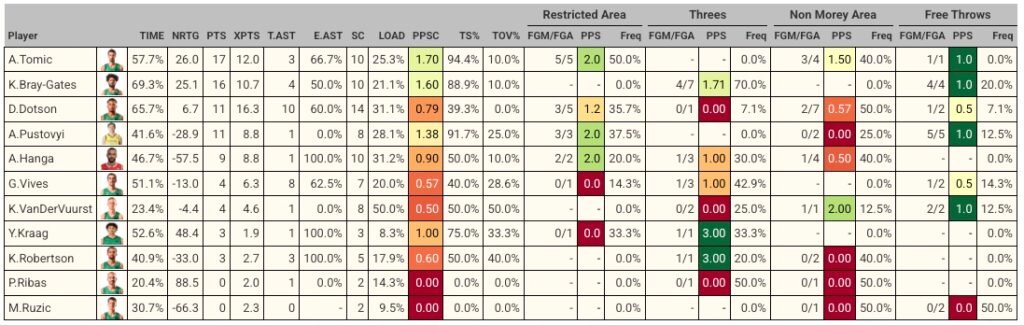
Player Advanced Box Score: advanced player statistics for the selected game
TIME: playing time, calculated as a fraction of possessions spent ont he court by the player;
NRTG: Net Rating when the player is on the court minus the team’s total Net Rating.
Net rating is the difference between OFFRTG and DEFRTG;
PTS: points scored;
XPTS: expected points;
T.AST: total number of assists T.AST = AST + PAST where PAST are potential assists and AST are actual assists;
E-AST: how many shots out of the total number of assisted shots were scored.
AST/T.AST*100;
SC: shot opportunities used by the player
LOAD: shooting opportunities used by the player out of the team total. Offensive load;
PPSC: points-per-shooting opportunity. PTS/SC. Measure of efficiency;
TS%: True Shooting %, shooting percentage that includes all types of shots (2pt, 3pt, free throws);
TOV%: percentage of possessions ending in a turnover;
Shooting performance: for Restricted Area (shots at the rim), Threes, Midrange (2-pt not at the rim), and Free Throws:
FGM/FGA: Field goals made / Field goals attempted;
PPS: Points per shot (FGM/FGA × shot value);
Freq: % of shot opportunities used for that type of shot
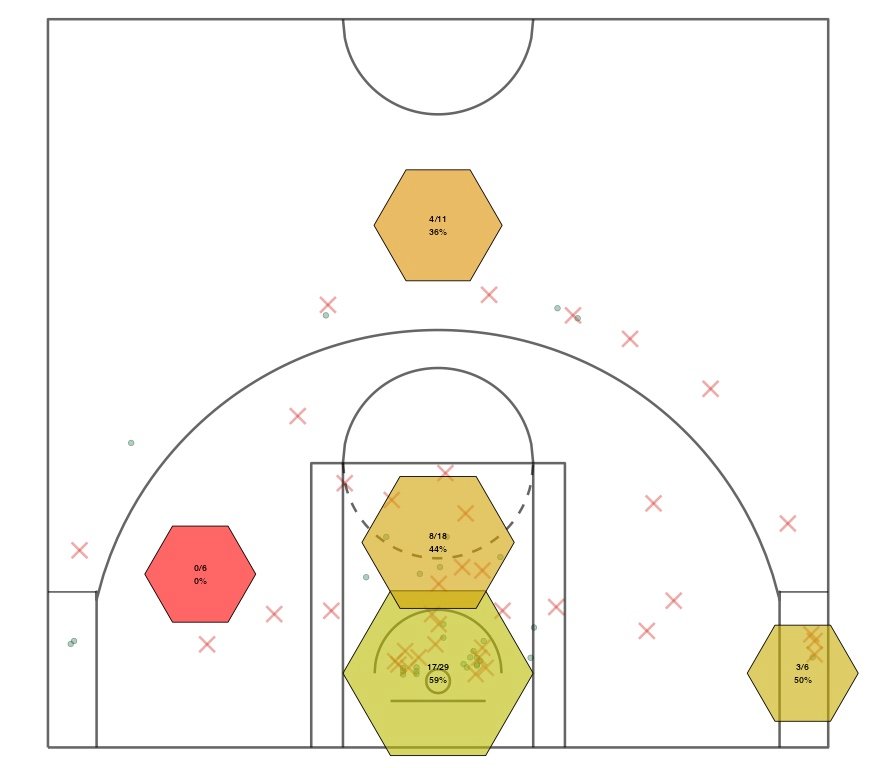
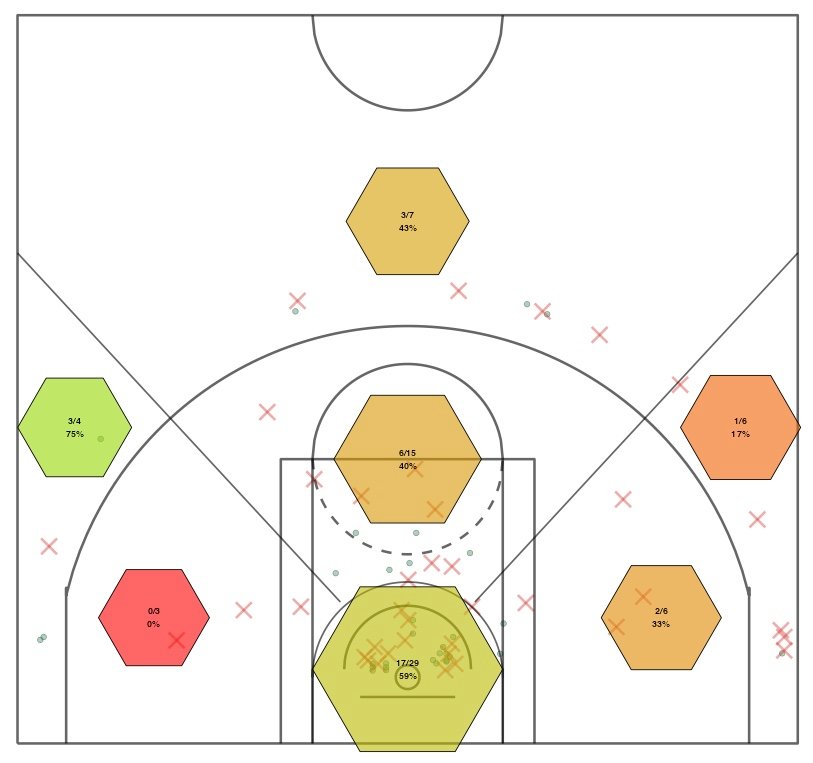
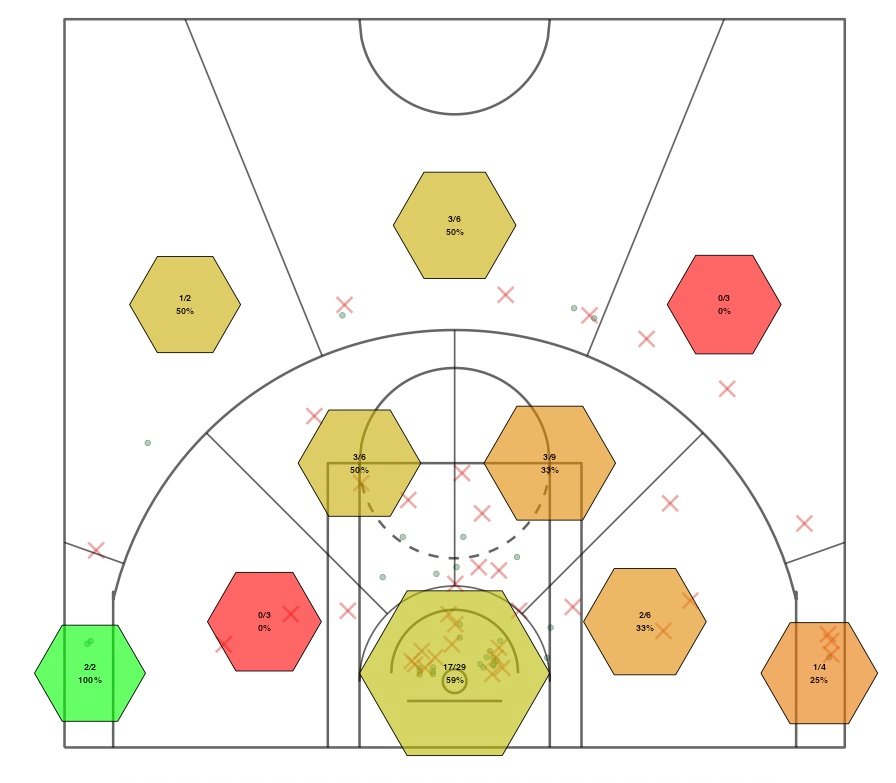
Maps 1 – Sectors
5 sectors 7 sectors 10 sectors