
GLOSSARY REPORT 2
Full advanced box score of all teams. Average data per game
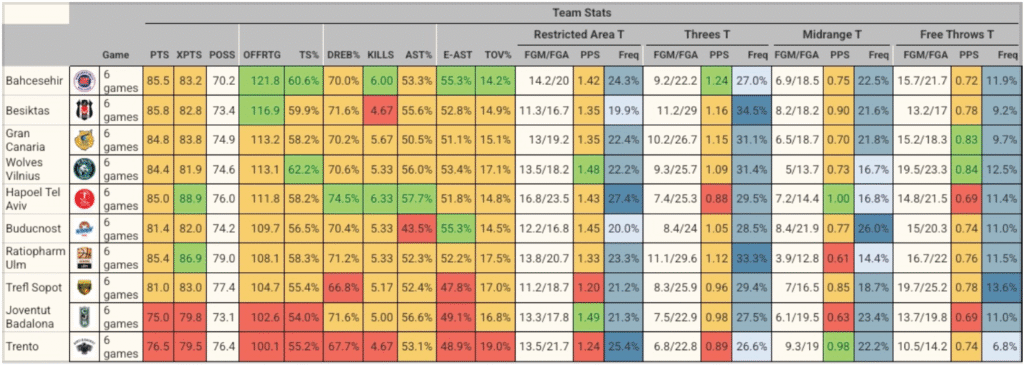
The data is from the team’s perspective (Team Stats) or from the opponent’s perspective (Opponent Stats).
Green means good, red means bad, yellow means average.
Columns colored in blue are frequency columns. Dark blue means more frequent.
PTS: points;
XPTS: expected points;
POSS: number of possessions;
POSS: number of possessions;
OFFRTG: points per 100 possessions;
TS%: true shooting percentage. Shooting percentage that includes all types of shots (2pt, 3pt, free throws);
DREB%: defensive rebound percentage, calculated as DREB/(DREB + OREB opponents);
KILLS: number of kills in the game. A kill is achieved by stopping the opponent’s attack for 3 consecutive possessions.
AST%: how many shots out of the total number of shots were assisted;
E-AST: how many shots out of the total number of assisted shots were scored;
TOV%: percentage of possessions ending in a turnover;
Shooting performance: for Restricted Area (shots at the rim), Threes, Midrange (2-pt not at the rim), and Free Throws:
Shooting performance: for Restricted Area (shots at the rim), Threes, Midrange (2-pt not at the rim), and Free Throws:
FGM/FGA: Field goals made / Field goals attempted;
PPS: Points per shot (FGM/FGA × shot value);
Freq: % of shot opportunities used for that type of shot.
Adding TOV% and all Freq gives 100%. It is therefore possible to study how a team distributes its shooting opportunities.
Expected Points Analysis: Offensive and Defensive breakdown
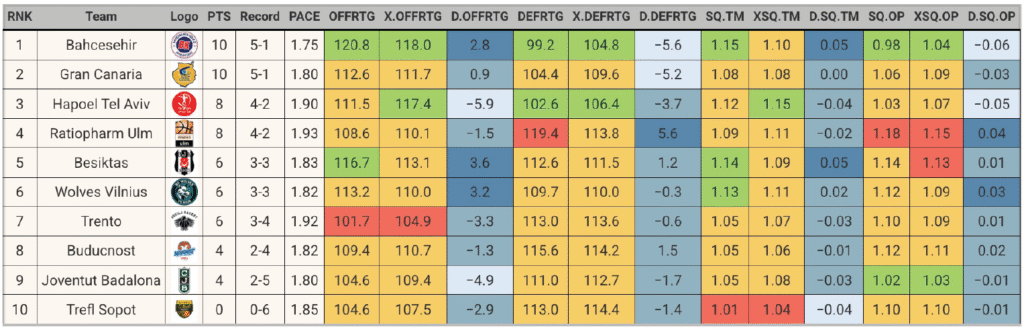
PTS: points in the standings
Record: wins-losses
PACE: game speed. Number of possessions per minute.
OFFRTG: points per 100 possessions;
X.OFFRTG: expected points per 100 possessions;
D.OFFRTG: OFFRTG – X.OFFRTG. Positive values indicate offensive overperformance, negative values indicate underperformance.
DEFRTG: points conceded per 100 possessions;
DEFRTG: points allowed per 100 possessions;
X.DEFRTG: expected points allowed per 100 possessions;
D.DEFRTG: DEFRTG – X.DEFRTG. Positive values indicate defensive underperformance, negative values indicate overperformance.
SQ.TM: team shot quality. Calculated as PTS/FGA;
X.SQ.TM: expected team shot quality. Calculated as X.PTS/FGA;
D.SQ.TM: SQ.TM-X.SQ.TM. Positive values indicate offensive overperformance, negative values indicate underperformance.
SQ.OP: opponents’ shot quality. Calculated as PTS/FGA;
X.SQ.OP: opponents’ expected shot quality. Calculated as X.PTS/FGA;
D.SQ.OP: SQ.OP-X.SQ.OP. Positive values indicate defensive underperformance, negative values indicate overperformance.
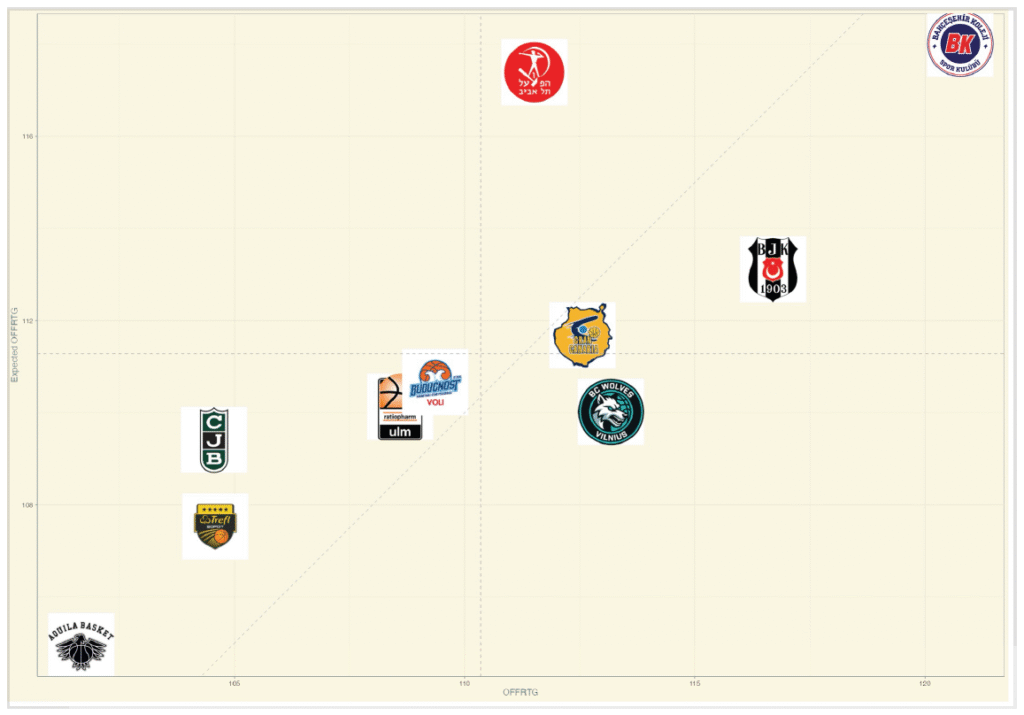
Team Performance Analysis: Scatterplot of selected variables
Graph in which you can choose one of the variables described in the previous table for the x-axis and y-axis.
Shooting Charts
In the ‘Filters’ menu, you can filter shots to generate graphs for left and right.
I can choose: team, range of days to analyze, quarters of play to analyze, filter by contested/uncontested shots, filter by assisted/unassisted shots, filter by home/away shots.
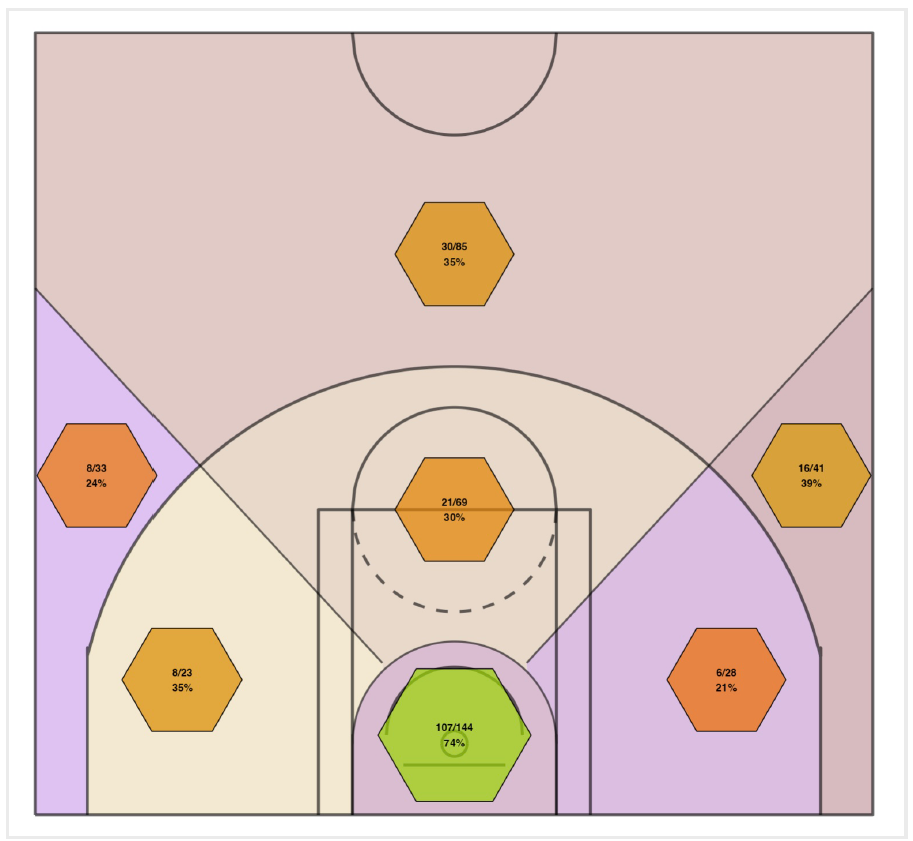
The first graph (Statistics by court sectors, team A and Statistics by court sectors, team B) shows shooting statistics in a certain number of sectors on the court.
The number of sectors can be selected from 5, 7, or 10.
The hexagon containing the statistics is colored according to the shooting percentage in that sector.
The sectors are colored differently to make them distinguishable to the user.
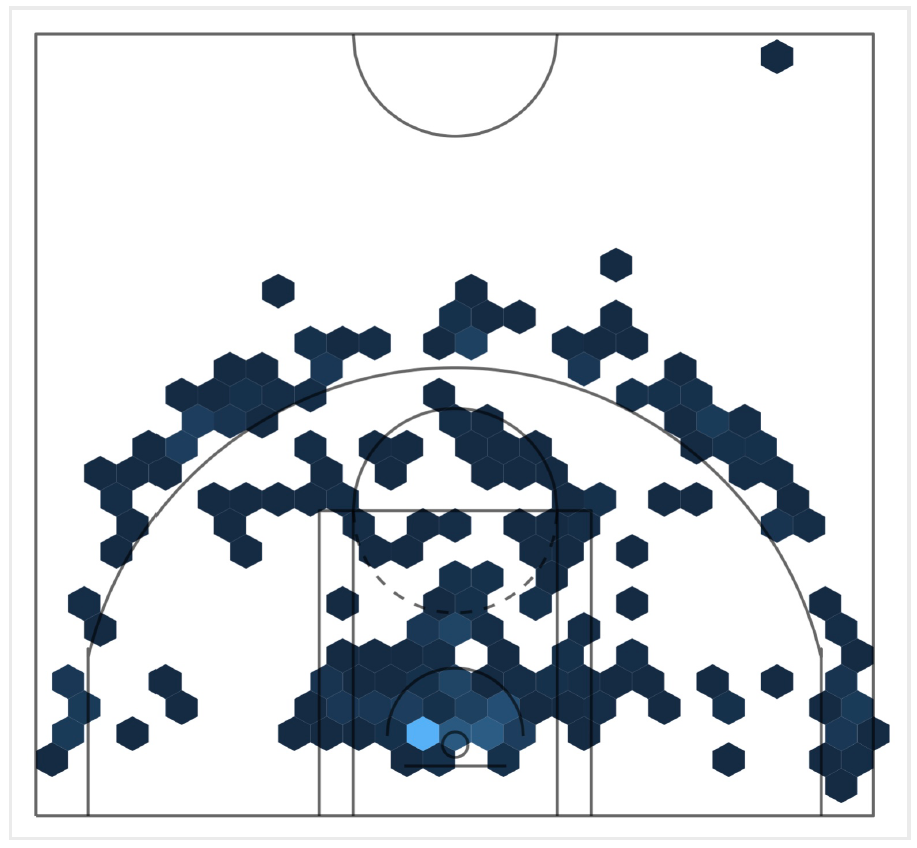
The second graph (Shot density, team A and Shot density, team B) shows an estimate of the density of the selected shots.
You can customize the number of hexagons to display on the x-axis and y-axis.
The hexagons change color based on how many shots are contained within them.
Light blue means many shots.
Shooting Breakdown
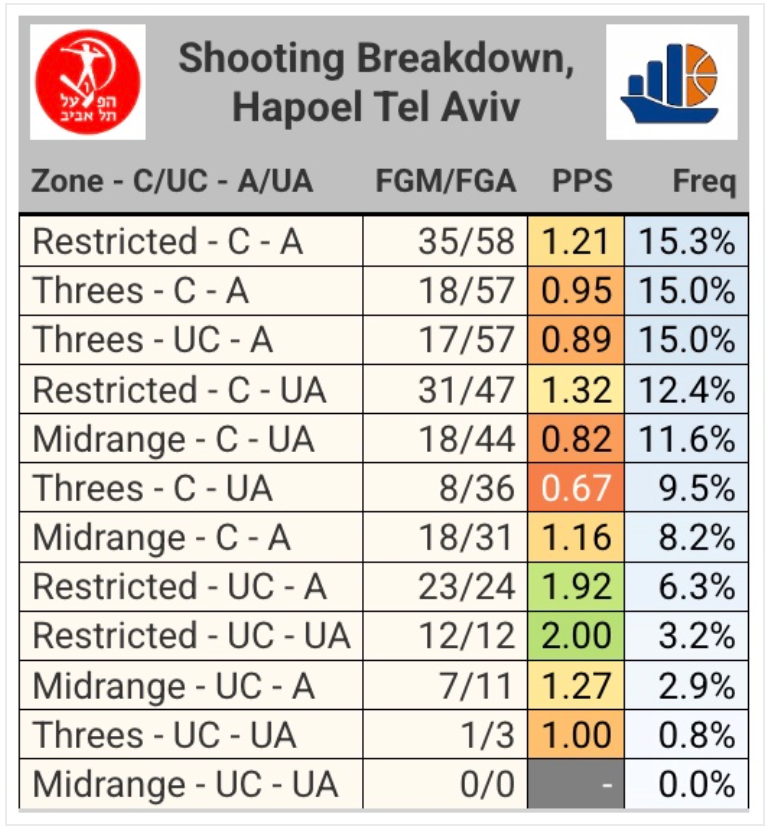
Zone-C/UC-A/UA: combination of field zone (Restricted, Midrange, or Threes), C/UC contested/uncontested, A/UA assisted/unassisted;
FGM/FGA: field goals made/field goals attempted;
PPS: points-per-shot. This is obtained by multiplying FGM/FGA * shot value.
Freq: frequency of use of that combination. Adding all the frequencies together gives 100%.